ET_Redux
 ET_Redux Repository
Introduction
The documentation below is essentially a set of step by step instructions on how to operate the software. For auditory and visual learners, youtube video tutorials will be included among the written instructions. ET_Redux is sponsored by EARTHTIME and funded in part by the National Science Foundation under Grant Numbers 0930223 and 1443037. Any opinions, findings and conclusions or recommendations expressed in this material are those of the author(s) and do not necessarily reflect the views of the National Science Foundation (NSF).
Procedures
GeoPass With ET_Redux
Once you have obtained your SESAR ID you can use this to register a sample. Your sample will be given a unique IGSN number. ET_Redux uses the IGSN as a source for metadata. You can now pull all of the metadata from SESAR to process the sample and ET_Redux can upload the data processing into Geochron - selecting public will make the samples viewable on a map. This functionality will allow samples to be viewable throughout the world.
Getting Your GeoPassId
Visit geochron.org to start the sign up process. Click on “My Account” to be directed to a login page. If you do not already have an account, click the “Sign up now!” link below the login form. Fill in the necessary fields and press the “Submit Registration” button. You will recieve a confirmation email with a link to confirm your account.
Remember your username and password. This login information will be needed while using ET_Redux.
Running ET_Redux
Double Click Method
Some systems will allow you to run a .jar file with the GUI simply by navigating to the file’s home directory and double clicking it.
From The Command Line
Open your preferred command terminal and navigate to the directory that contains the ET_Redux .jar file. Then run the following command:
$ java -jar ET_Redux<version>.jar
Learn more about using a command line here.
Note: This command should work for all operating systems.
New Project from Raw Data
The following goes through some basic methods and procedures for opening/starting a new project in ET_Redux.
- Open ET_Redux - note that this will generate two html files, ChangeLog.html and Credits.html
- To start, click “Project” in the top left corner.
- Then click “New Project” from Raw Data.
- Click “LA-ICP-MS”. Note that IDTIMS raw data is currently processed by our software Tripoli.
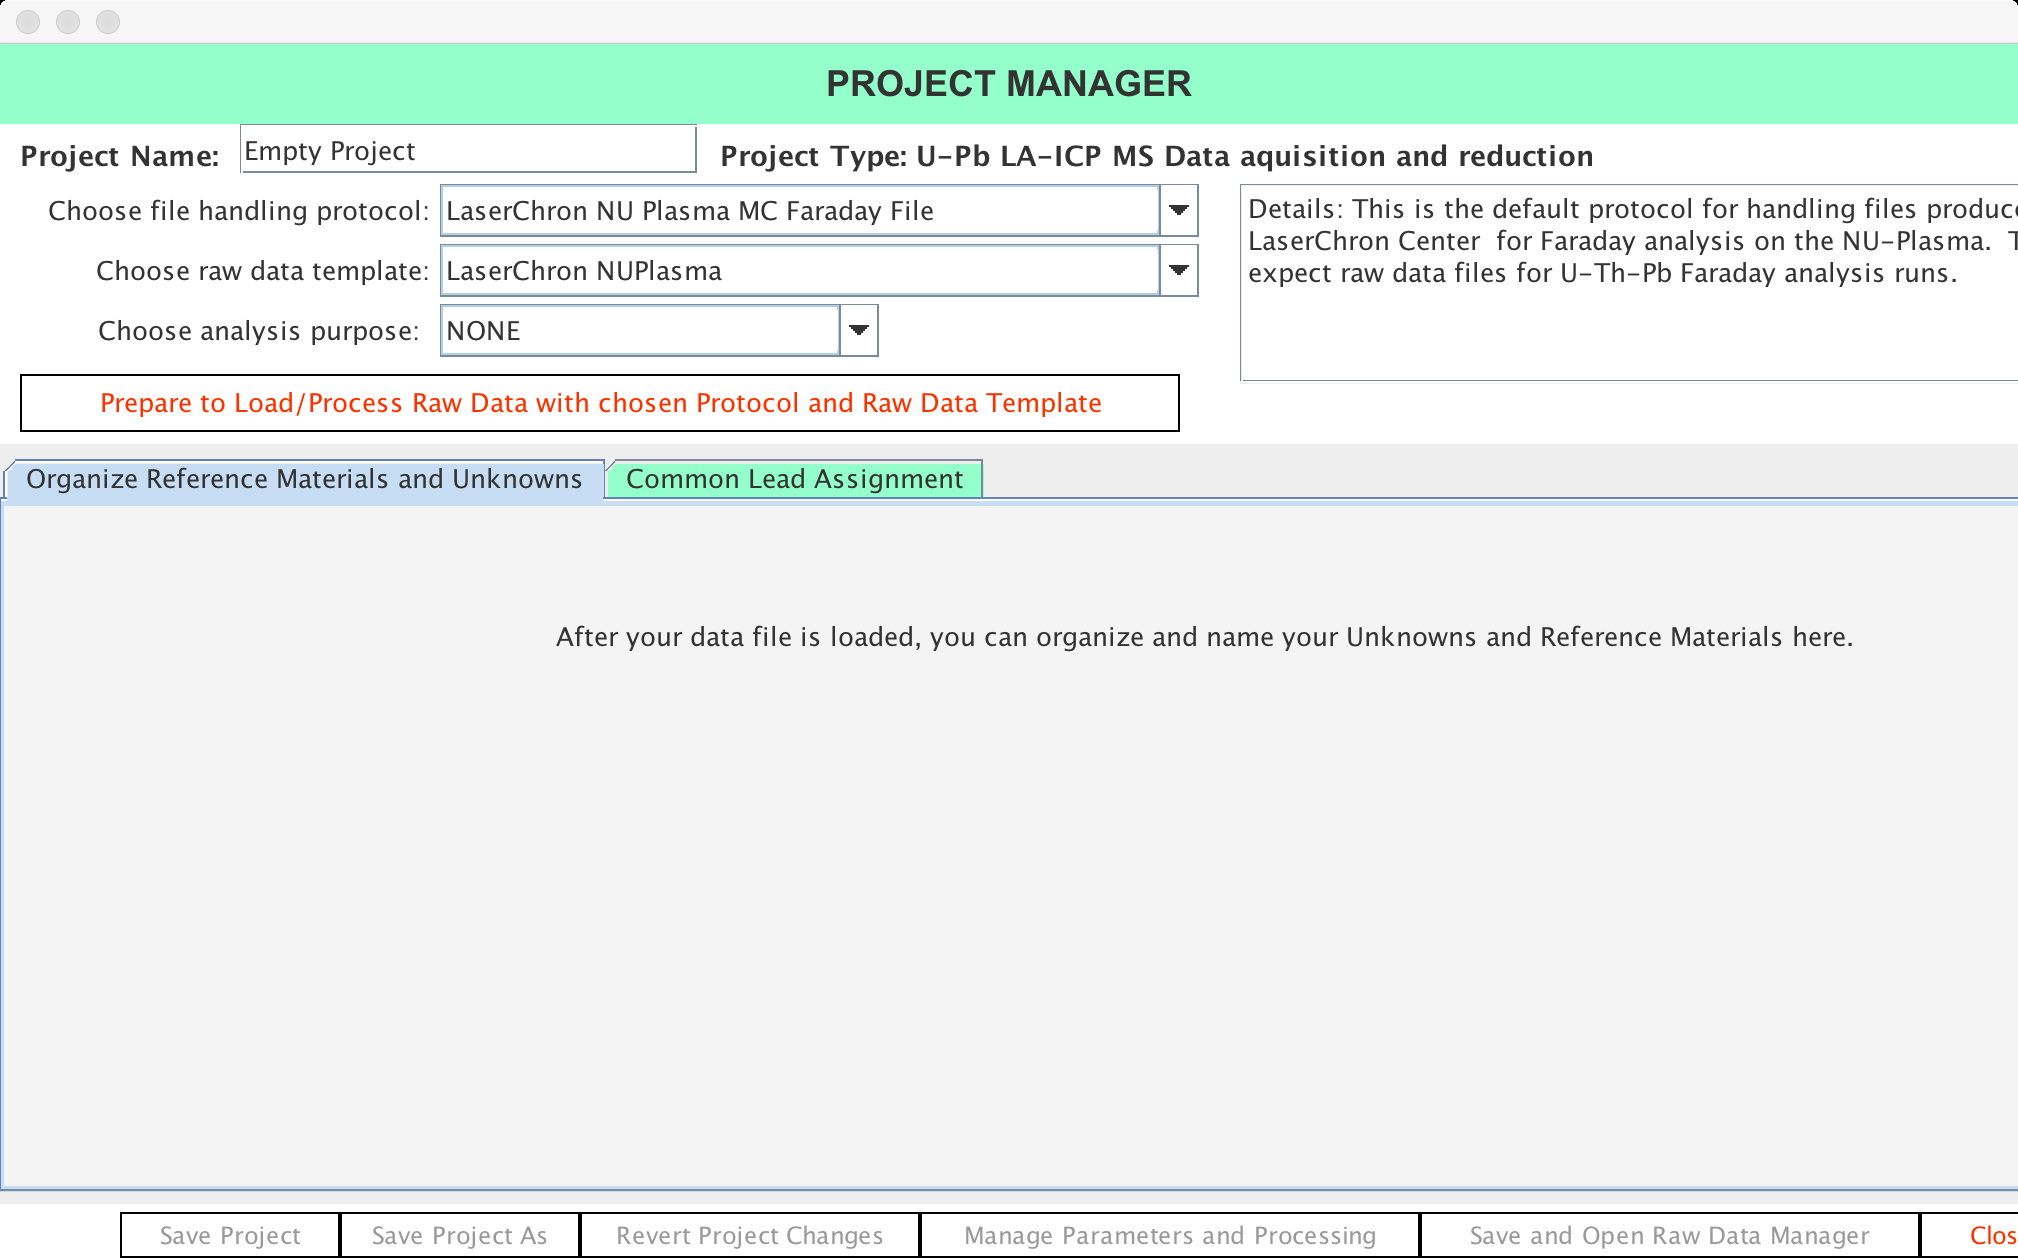
- Now you will see the Project Manager interface where you specify your project. Start by entering your Project Name and then choosing the appropriate:
- File Handling Protocol
- Raw Data Template
- Analysis Purpose
- Finally, click “Prepare to load/Process Raw Data.” Then, depending on your file handling protocol you will be able to select your data file or data folder and then click “Open” to show the parameters manager. If you use folders, be sure that all necessary files are present.
- Confirm that all parameters are correct - the defaults are shown initially.
- Full Uncertainty propagation is the default - use the fast option to explore datasets only.
- Select your Primary Reference Material. Note the default is set in the Lab Settings Manager.
- Now you are ready to start the reduction process. You can either start a live session while the mass spectrometer is producing data or proceed to reduce an already-collected dataset as explained below.
Project Raw Data Manager
- Consider using the following view options singly or in combination to explore your data:
- Y-axis Scaling set to Independent
- Show All Local Y-axis
- Make horizonal zoom very tight to highlight patterns in data
- Start with the default “Intercept” method tab.
- Review the reference materials to make sure ratios are within acceptable rages. It will be very clear when an analysis is bad. You will either see a very large scatter in data points or the fit line will be far off the data points. Be sure to select the appropriate fit functions on a ratio-by-ratio basis, or even for each graph.
- Click “Show Session” button.
- The time-based session views for each ratio plot the reference materials and their 1-sigma absolute uncertainties in black and over-dispersion of uncertainties in red, if calculated. Each session can be fitted with a choice of mean, line, exponential or spline functions.
- To remove a data point for a reference material, hover over the black dot and right click. You will be asked to “exclude this fraction”, click on it and the black dot will change to red indicating it has been removed.
- Once you have removed all unwanted data points you MUST click “Refit” on the left update the plot and MSWD.
- Next, click “Fit Unknowns” and evaluate each fraction and ratio for the unknowns and the secondary reference materials, which are also treated as unkowns.
- When you are happy with your fits, to complete your reduction click “Update Report Table”, which will remain grayed out until it finishes and then returns to the color white.
- Return to the main window showing the data table and click “Sample Dates” in the bottom right to launch the sample date manager with the concordia, weighted means, and PDF plots and views.
Live Data Reduction Processing
- Click “Save and Monitor/Process Raw Data”
- Once the live data monitor is launched you will have to wait for at least 3-4 analysis to be recorded by the mass spectrometer software and processed by ET_Redux before seeing any data.
- To reject an analysis, right click on the selected fraction name in the report table located in the bottom portion of the manager and it will be sent to the rejected fractions tab but will still be reduced.
- To look at individual samples (Reference Materials or Unknowns), double click on the project name in the panel to the left of the concordia, and a drop down menu will show all available groups to view on Concordia and on the PDF. Note that the reference materials both primary and secondary will not appear in the PDF view.
- To set filters for percent discordance and percent uncertainty, adjust the sliders in the panel under the PDF. To apply them to the Concordia plot, select “apply filters” checkbox under the Concordia. To set the sliders to the default values specified in the lab data manager, click “Default”, and to clear the filters, click “Clear”.
- To change what dates are shown on the PDF, select one of the three dates (6/8, 6/7, or best date). We suggest the best date option.
- Best date filter can be changed while you are looking at unknowns in Concordia space by sliding the blue best date handle on the vertical axis.
- When a fraction is removed be patient as it will take until the next primary reference material fraction to update the session.
- If you need to refresh, click “Refresh Views”
- Wait until the run has completed and proceed to Project Raw Data Manager (see below).
Load Sample
Run ET_Redux and you will be presented with a welcome screen. Click “Open Sample” at the bottom of the window. You will be prompted to select a Redux sample file. Browse to where you placed the unzipped synthetic data. Select a file with the .redux extension in CM/CM_Redux/. A table containing your data will appear on the screen. From here you can view graphs and generate concordia graphs.
Using the Workflow Manager
The Workflow Manager can be accessed by clicking Sample in the top menu of ET_Redux. You will be presented with several options for creating and editing a sample. To create a new sample, click New Sample Analysis for ID-TIMS. This opens the Workflow Manager for a new sample.
New Sample Analysis for ID-TIMS
After you have loaded data for a sample, you can use ET_Redux’s tools for interpretation of the geochronological data. ET_Redux supports data reduction and interrogation of new U-Pb analyses. You can organize the data reduction using specialized managers for lab data, aliquots, fractions and sample dates.
Editing the Sample Name
To change the name of your sample input the desired name into the Local Sample Name box.
Adding an IGSN ID
To specify the IGSN, select the registry from the Registry drop down menu and input the ID into the Sample ID box. Click the button to the right of where you input the ID to validate the registry.
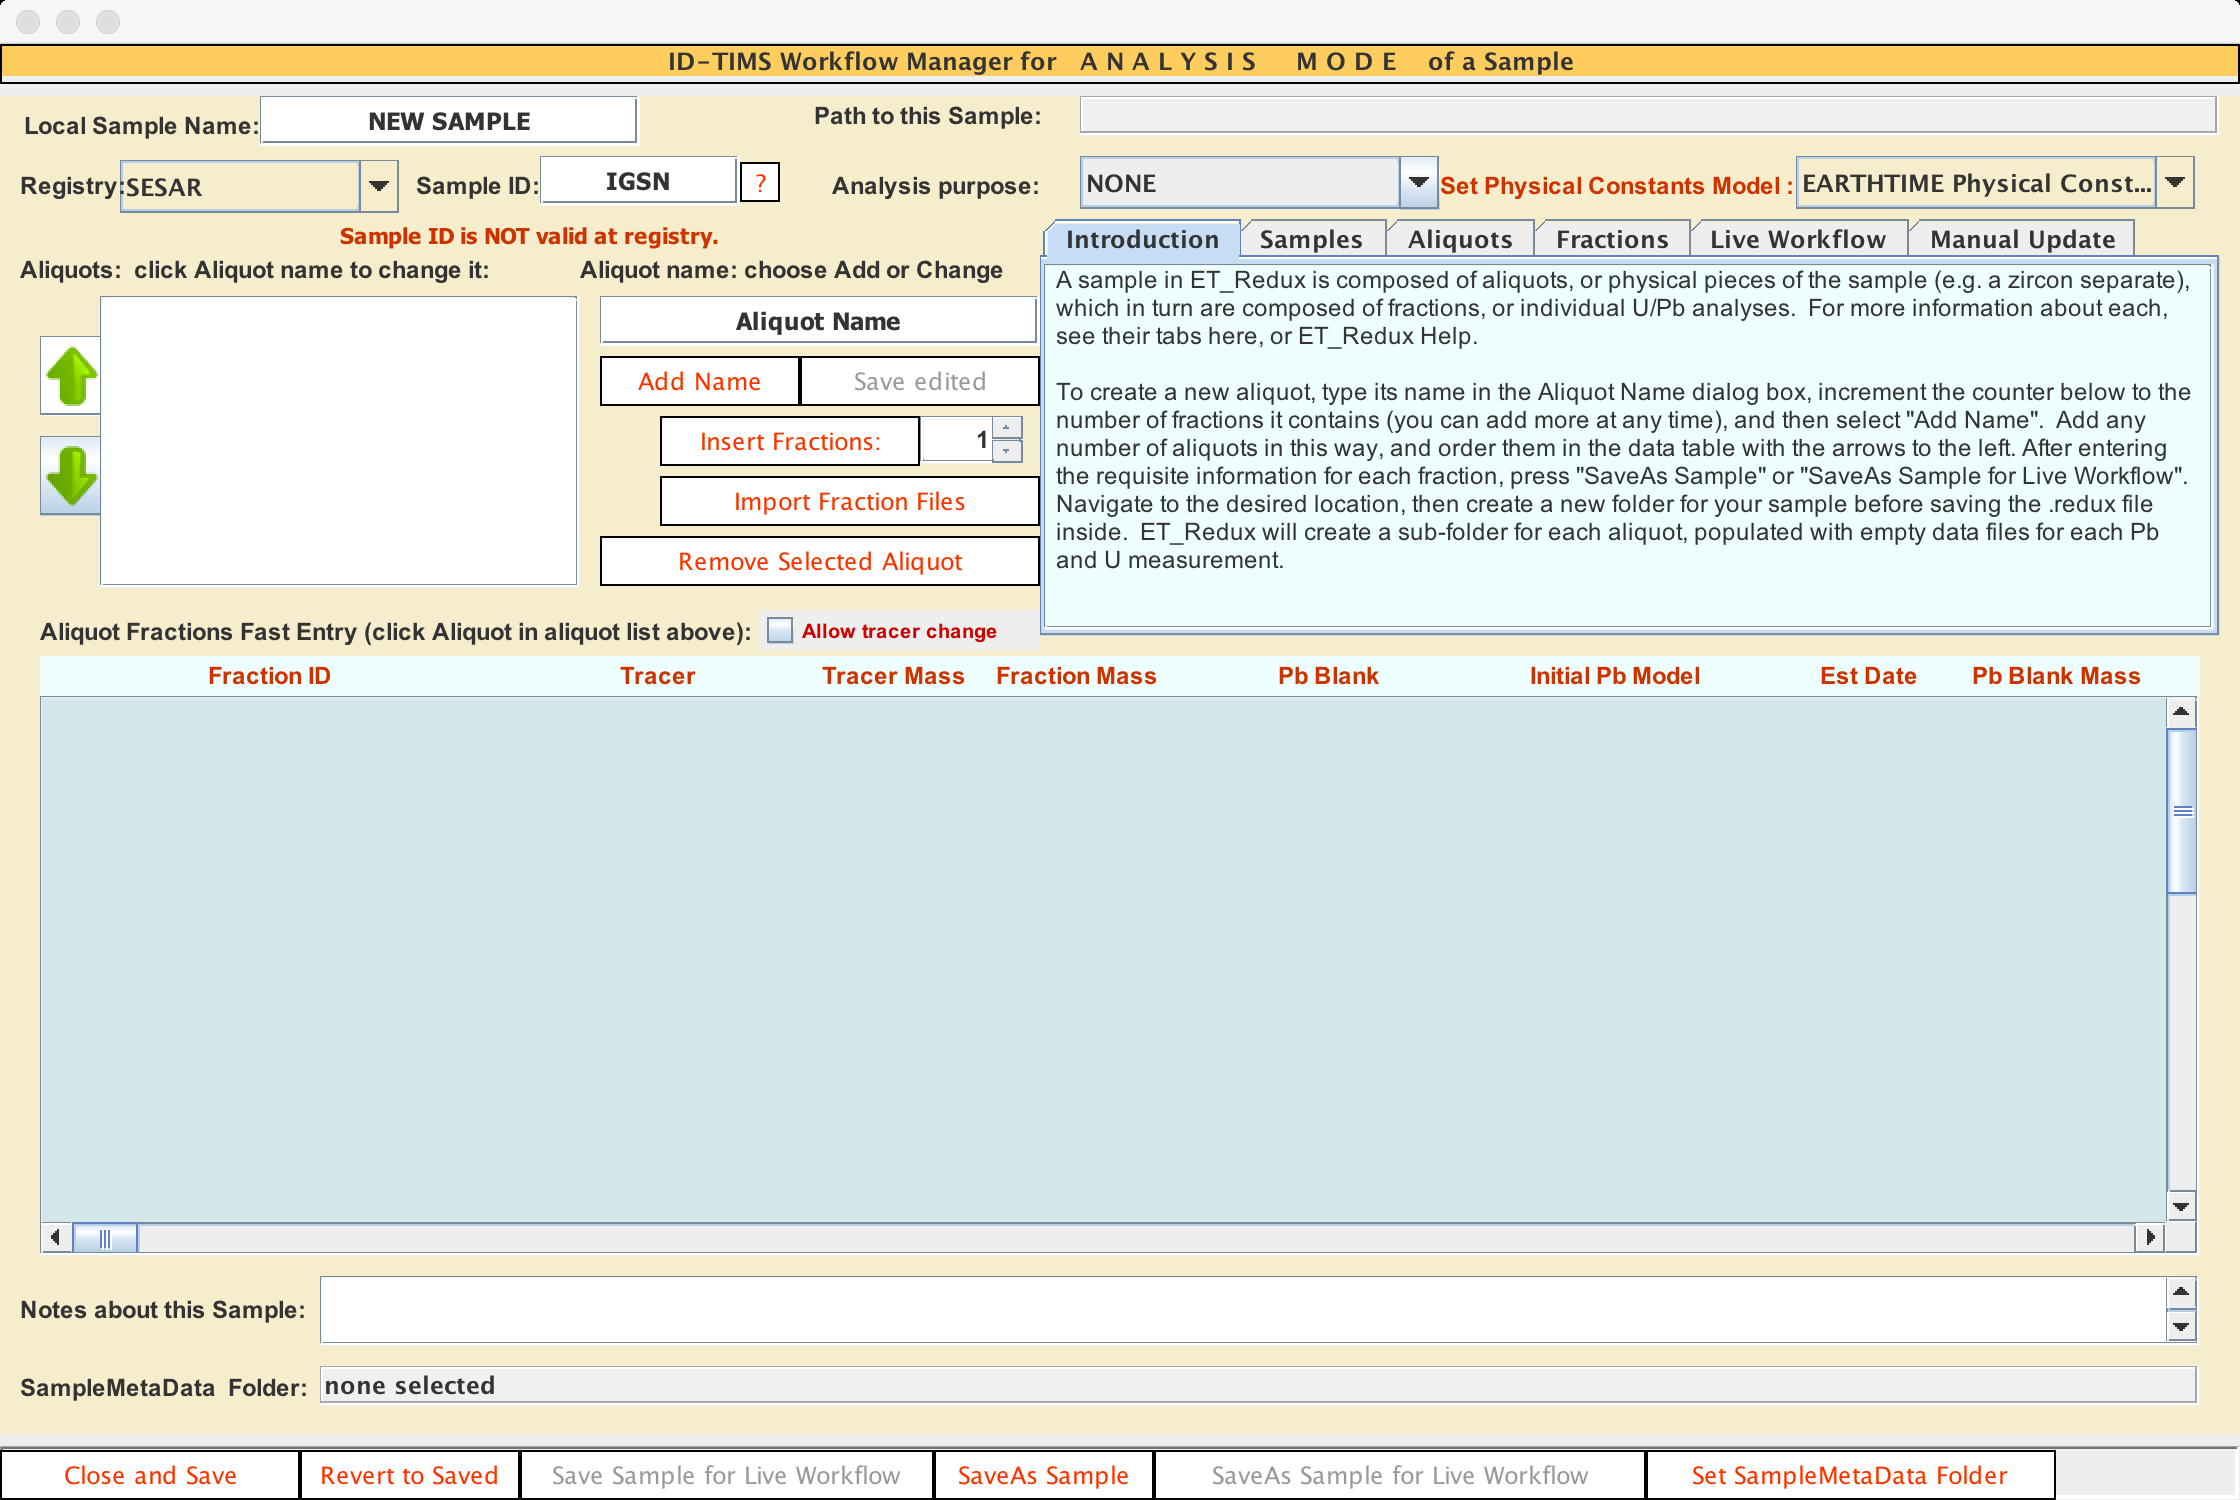
- At the main menu, click “Sample” and then click “New Sample Analysis for ID-TIMS” to launch the ID-TIMS Workflow Manager for ANALYSIS MODE of a Sample. Here you will find all you need in creating and adding aliquots. You can always return to this window by clicking the “Manage Sample” menu item under the main menu “Sample”.
- Name your sample using the Local Sample Name dialog box and provide the “IGSN”. SESAR is the default registry to date.
- Select the “Analysis Purpose” and the “Phsyical Constants Model”.
- To create a new aliquot, start by typing in a descriptive name, such as “zircon”, into the Aliquot Name dialog box. For each aliquot, provide the name and then click “Add Name” to add the aliquot to the left-hand list. Once this list is populated with the names of the aliquots, clicking each name sets up the next step of either manually “inserting fractions” or “importing a folder of fractions” (click on Import Fraction Files), which consists of XML files produced by Tripoli or similar software. These XML files must conform to the schema found here.
For an example - open up CM2 and find the folder zircon. Here you will find a multitude of xml files that have been exported from Tripoli. They come in pairs of lead and uranium. Open both of the files the lead and uranium. (z10 for example. ) It will populate one line of the fraction. One row is one fraction.
- Fractions and aliquots may be removed using the appropriate buttons. If importing is done, the default fraction should be removed.
- For each fraction of each aliquot complete the entries in the interactive data table at the bottom of the window.
- For manual update, Click “Close and Save” button.
- For Live Workflow, be sure to set the following parameters before clicking “Close and Save” button.
- one
- two
- three
Aliquots
Using the Aliquot Manager
Use the Aliquot Manager to organize the input parameters for the fractions in an aliquot, collate notes and metadata about the aliquot, and archive the reduced data to a database. To access the Aliquot Manager, click Aliquots and select the aliquot you would like to view or just click the aliquot’s name in the main window. The Aliquot manager will open in a new window. The Aliquot Manager has five tabs situated near the bottom of the window.
Adding Aliquots
To add an aliquot to your sample, type the name of the aliquot in the Aliquot Name box and click Add Name. This will add your aliquot to your sample’s aliquot list. You can select an aliquot from that list to edit or remove it. If you ever want to change the name of an aliquot, select it from the list, change the name in the Add Name box, and click Save Edited.
Adding Fractions Manually
Select an aliquot from the sample’s aliquot list. Then click Import Fraction Files and navigate to your sample’s fraction files which are saved as XML documents. You can import multiple fractions at a time by holding CTRL and clicking the files.
Click Add Name to add the new aliquot. Increment the counter below to change the number of fractions it contains (you can add more at any time). Press Insert Fraction to add more fractions.
Order the fractions in the data table with the arrows to the left. After entering the required information for each fraction, press “SaveAs Sample”. Navigate to the desired location, then create a new folder for your sample before saving the .redux file inside. SaveAs Sample controls the name and location of where you are saving - use “Close and Save” to save and close out of the project.
Fraction Fast Details Tab
The Fraction Fast Details tab is the first tab you will see after opening the Aliquot manager. It contains a table with a row for each fraction and a column for each possible input reduction parameter organized into four groups which are broken down into further groups:
- Laboratory Data
- Fraction Name
- No Initial Pb
- Tracer Model
- Tracer Mass, Uncertainty
- Fraction Mass
- Pb Fractionation model
- U Fractionation model
- Common Pb
- Pb Blank IC model
- Pb Blank mass, uncertainty
- Initial Pbc IC model
- Estimated date
- Pbc model uncertainty
- Uranium
- Sample 238U/235U, uncertainty
- Blank 238U/235U, uncertainty
- U Blank mass, uncertainty
- Uoxide 18O/16O, uncertainty
- Initial Isotopic Disequilibrium
- Th/U of magma, uncertainty
- 231Pa/235U activity ratio, uncertainty
Fraction Notes Tab
The Fraction Notes tab displays a concatinated list of the fractions in the aliquot and their corresponsing notes.
Fraction Archiving Details Tab
The Fraction Archiving Details tab allows you to edit the archiving details of your fractions.
References, Metadata and Consistency Tab
The References, Metadata and Consistency tab allows you to edit the references and metadata for your aliquot.
Archive Aliquot to Database Tab
The Archive Aliquot to Database tab allows you to archive your aliquot to a database using its IGSN number which you set with the Sample Manager.
Using the Fraction Manager
The Fraction Manager provides detailed information about each paired U-Pb analysis organized into tabs. These tabs, situated at the bottom of the fraction manager, include Pb Data, U Data, Tracer, Corrections, Pb Blank, Initial Pb, Reports, Archiving Details, and Kwiki.
Adding Fractions with Live Workflow
The Live Workflow mode establishes a direct link between Tripoli and ET_Redux. To enable Live Workflow, you must create a folder called “SampleMetaData” and then click the Set SampleMetaData Folder button. Tripoli must also be told the location of this SampleMetaData folder. In Tripoli, point to this SampleMetaData folder with the Set Live Workflow Data Folder item from the Control Panel menu. Clicking the START Live Workflow button at the bottom of ET_Redux’s main screen immediately imports data from Tripoli and prompts ET_Redux to update its calculations.
Tabs
Kwiki Tab
The most informative tab of the fraction manager is the Kwiki tab. The left-hand panel of the Kwiki tab is a table with a row for each input parameter. The columns display the name, value, and uncertainty of the input reduction parameter. The values and their uncertainties are displayed with miniature sliders. As you adjust the sliders the data is rereduced and the changes are reflected in the three other data panels. The sliders are intended for hypothesis testing and data exploration only. All changes are temporary and will be reset upon exiting the Kwiki tab.
The top center panel of the Kwiki tab displays important data reduction parameters such as how the analysis is apportioned between laboratory blank, initial common Pb, and parent or daughter Pb or U. These values change in response to the value sliders.
The top right panel is a U-Pb concordia plot that displays uncertainty ellipses for fractions in the aliquot. The current fraction’s ellipse will be highlighted. This ellipse responds to movement of the value and uncertainty sliders in real time. You can navigate the concordia plot by panning and zooming with the mouse or by using conventional navigation tools in the control panel to the left which also contains a toolbox for manipulating the uncertainty contributions and viewed corrections.
The bottom panel shows the three calculated dates for the fraction, their uncertainties, and a graphical breakdown of each date’s variance by the contribution from each input parameter. These graphs respond to both value sliders and uncertainty sliders.
The Kwiki tab provides a live view of the data reduction progress in Live Workflow mode while Tripoli is updating data for ET_Redux in real time.
Pb Data and U Data Tabs
The Pb Data and U Data tabs provide a view of the input ratios and their uncertainties. You can compose fraction-specific notes and see the file path of the imported data. On the U Data tab, you can also enter an estimated date, uncertainty, and U fractionation magnitude to estimate U isotope ratios for visualization in the Kwiki tab before the U measurement is made.
Tracer Tab
The Tracer tab displays the isotopic composition and U/pb ration of the selected tracer defined data model, as well as the mass of tracer added to the selection fraction and its uncertainty. This tracer may be imported from Tripoli, or chosen from the dropdown list at the top of the tab.
Corrections Tab
The Corrections tab displays information about Pb and U fractionation corrections, oxide correction, and U sample components. The magnitude of the fractionation correction applied to Pb and U measurements are shown. One of four possible techniques is used to determine the correction as signified by a red box.
- Tripoli performed fractionation correction point by point using the measured ratios from a double spike
- An average fractionation value was calculated from the mean double-spike ratio
- For a monoisotopic tracer, a fractionation model was applied
- The fraction is not corrected for fractionation
Oxide correction parameters for uranium oxide analyses are displayed in the middle of the Corrections tab. Tripoli performs oxide corrections automatically, but ET_Redux allows you to recorrect the data by supplying a different 18O/16O from the value used by Tripoli and to specify the uncertainty.
Pb Blank Tab
The Pb Blank Tab shows the details of the selected laboratory Pb blank defined data model.
Initial Pb Tab
When the fraction is identified as having no initial Pb, the Initial Pb tab displays details of the defined data model chosen for the initial common Pb IC. There are two ways to specify the initial common Pb IC:
- Use a common Pb ore evolution model.
- Select a custom defined data model.
Archiving Details Tab
The Archiving Details tab serves as the preparation portal for each fraction to be archived as part of the aliquot. Annotations about the fractions are made here. Also, you may upload an image of the fraction and record your comments.
Using Geochron Data
- Click Sample in the main menu, and then click New Compilation of Aliquots into a “Super-Sample” File.
- Name your compilation sample then select Import one or more Aliquots from Geochron.org database.
- Input your Geochron username (email) and password.
- Press Proceed to Aliquot Chooser.
- Input one or more Aliquot IGSN from Geochron.
Reports Overview
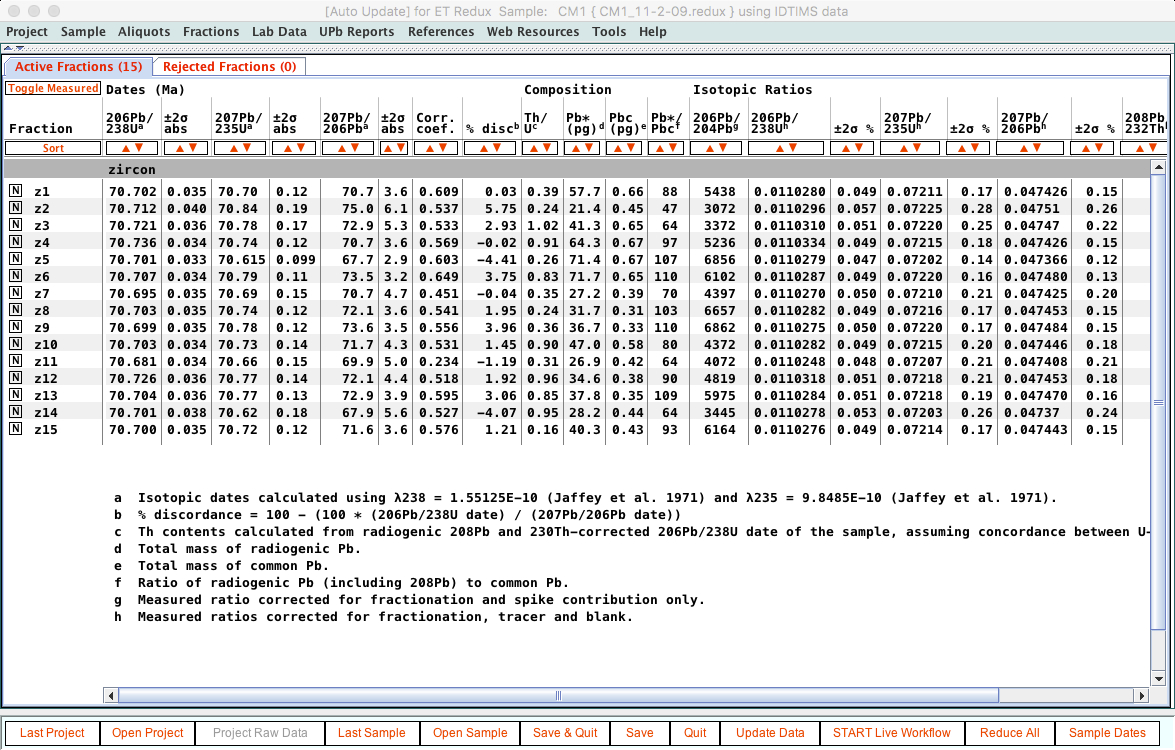
The Reports menu gives the user control over ET_Redux’s data table through the reports settings model. The reports setting menu title will change in response to the isotope system as, for example, ‘UPb Reports’ and ‘UTh Reports’. ET_Redux allows the user to customize and save report settings models as XML files that can be applied to and saved with any ET_Redux data set, shared with other users, and used to format data tables downloaded as aliquots from GeoChron.org on our Android mobile app CHRONI.
The data table is organized by categories that each have columns. For example the category ‘Dates’ includes columns for date ‘206Pb/238U’ and its associated uncertainty. Other categories currently available include Fraction, PbcCorr (Common lead corrected) Dates, Composition, Isotopic Ratios, PbcCorr Isotopic Ratios, Correlation Coefficients, and Trace Elements. Customized footnotes are automatically generated and kept in alphabetical order from left to right. The rows are organized by aliquots, which contain one fraction or analysis per row.
Reports Tab
The Reports tab allows you to write two files:
- A file containing all the inputs, intermediate variables, outputs, and their uncertainties.
- A file containing all of the covarience and Jacobian matrices used in the uncertainty propagation algorithms.
Reports Settings Manager
The Report Settings Manager is available as the first item under the Reports menu. The manager allows the user to customize the data tables produced by ET_Redux by choosing and ordering the categories, and choosing and ordering the columns within each category. To hide or show a single category or column, double-click it or use the hide/show button. The show ALL or hide ALL buttons hide or show all of the elements at once. Each column can be customized relative to whether significant digits are used to format the numerical entries in the table. Units of Ma or Ka are available for the Dates category.
The next two options on the Reports menu provide for Saving and Loading customized report settings as XML (extensible markup language) files. The schema for report settings can be found here for those readers interested in the details. A note to users - from time-to-time the schema change to accommodate new features and may require re-customization of reports.
ET_Redux supports saving default report settings to customize your use of the software. You can specify any saved report settings XML file as your default or use the EARTHTIME recommended default.
Finally, you can export data table reports as PDF, SVG, Excel, or CSV files.
Using the Lab Data Manager
From the Lab Data Manager you can import, create, and manage defined data models of data reduction parameters, such as for tracers, Pb and U fractionation, laboratory Pb blank and initial common Pb isotopic compositions, physical constants, mineral standards, and rare earth elements. ET_Redux saves the selected models with each sample file so they are available to anyone using ET_Redux to access the file. Just select Lab Data from the top menu of ET_Redux to manage your data models.
Glossary
Aliquot- phsyical pieces of a sample whose dates you wish to interpret seperately.
Fraction- a paired U+Pb analysis
Live Workflow - establishes a direct link between Tripoli (another CIRDLES software product) and ET_Redux.
Project - collection of samples
Sample - A single collection of a geologic material (usually rock or mineral) from one location. A sample has a lab specific name and a unique identifier such as the IGSN provided by SESAR. It is composed of aliquots or physical pieces of the sample.
Data Reduction - The transformation of information into an ordered, simplified form by reducing it to meaningful parts.
EARTHTIME - An initiative to facilitate cooperation among geochronologists with the goal of sharing ideas and approaches for eliminating or minimizing interlaboratory and intertechnique biases. Read more here.
End-to-end Data Processing - A system that takes a raw data input and transforms it into archived analysis results.
Fractions - A fraction encapsulates the isotopic data for an analyzed volume of a mineral without being lab specific. A fraction is paired U+Pb analysis. For instance, a zircon analyzed by TIMS or a spot zapped by LA-ICPMS would be separate fractions, even if both analyzed the same grain.
GeoChron - A community-based database and World Wide Web portal for data access that serves U-Pb geochronology. It is a joint project of EARTHTIME and EarthChem. Read more here.
IGSN (International Geo Sample Number) - A unique identifier given to a sample.
Metadata - Data about the sample
Sesar (System for Earth Sample Registration) - A centralized registry that provides unique identifiers for samples. Read more here
Uncertainty Propagation - The process of determining the error of a calculation's result.
XML (Extensible Markup Language) - The modeling language CIRDLES uses to model logical data models. XML is an emerging standard for modeling data because it provides for precise declarations of data that are independent of any specific presentation of data, andy software or any specific hardware. The World Wide Web Consortium (W3C) defines XML at www.w3.org/XML.