Topsoil
Introduction
Topsoil is a free and open-source, cross-platform application and library written in Java that creates interactive data visualizations for geochronological data. “Topsoil” is an anagram of “Isoplot”, the name of an enormously successful Microsoft Excel Add-In with similar capabilities, developed by Kenneth Ludwig, which now works only in older versions of Excel.
Geochronology is concerned with determining the age of rock samples. Dr. Kenneth Ludwig of the Berkeley Geochronology Center (BGC) developed Isoplot as a means for geochronologists to create visualizations for their data in Excel, as well as to perform common analyses and calculations. Currently, no version of Excel supports Isoplot past Excel 2010. Because Isoplot is no longer maintained, it is incompatible with recent versions of Excel, and because its code isn’t freely available, using it today can be impractical or impossible.
Topsoil, a Visual Basic add-in for Microsoft Excel for analyzing and visualizing geochronological data, addresses these issues by taking a community-driven approach to development, eliciting and responding to feedback from users to direct project action, and by releasing the code on GitHub for anyone to see or modify.
Topsoil is developed by a rotating team of students in the Cyber Infrastructure Research and Development Lab for the Earth Sciences (CIRDLES) at the College of Charleston, under the direction of Dr. James Bowring. It can be run on any platform with Java installed, and its code is available freely on GitHub.
System Requirements
Topsoil will run on Windows (x86 and x64), Linux (x86 and x64), and macOS (x64 only). The system must have the most recent version of Java installed.
Terms
Isotope System - An option based on the type of radiometric analysis produced by the data in question. Currently, the only two supported dating schemes are Uranium-Lead (U-Pb) and Uranium-Thorium (U-Th).
Unct. - An abbreviation for "Uncertainty".
Evolution Matrix - A plotting feature for the U-Th isotope system with a set of isochrons and contours.
UsingTopsoil
Onboarding Tutorial
Step 1: Clone Topsoil from GitHub
-
Navigate to the Topsoil GitHub Repo
-
copy and paste this into your terminal:
git clone https://github.com/CIRDLES/Topsoil.git
Step 2: Utilizing Topsoil
There are a few different ways to display and utilize the topsoil repository on your computer. If you’re using an integrated development environment (IDE), the project import process will depend on which one you have.
Topsoil uses Gradle as a build tool. The main class of Topsoil is located in Topsoil/app/src/main/java/org/cirdles/topsoil/app/ and is called MainWindow.java.
-
Terminal (classic)
-
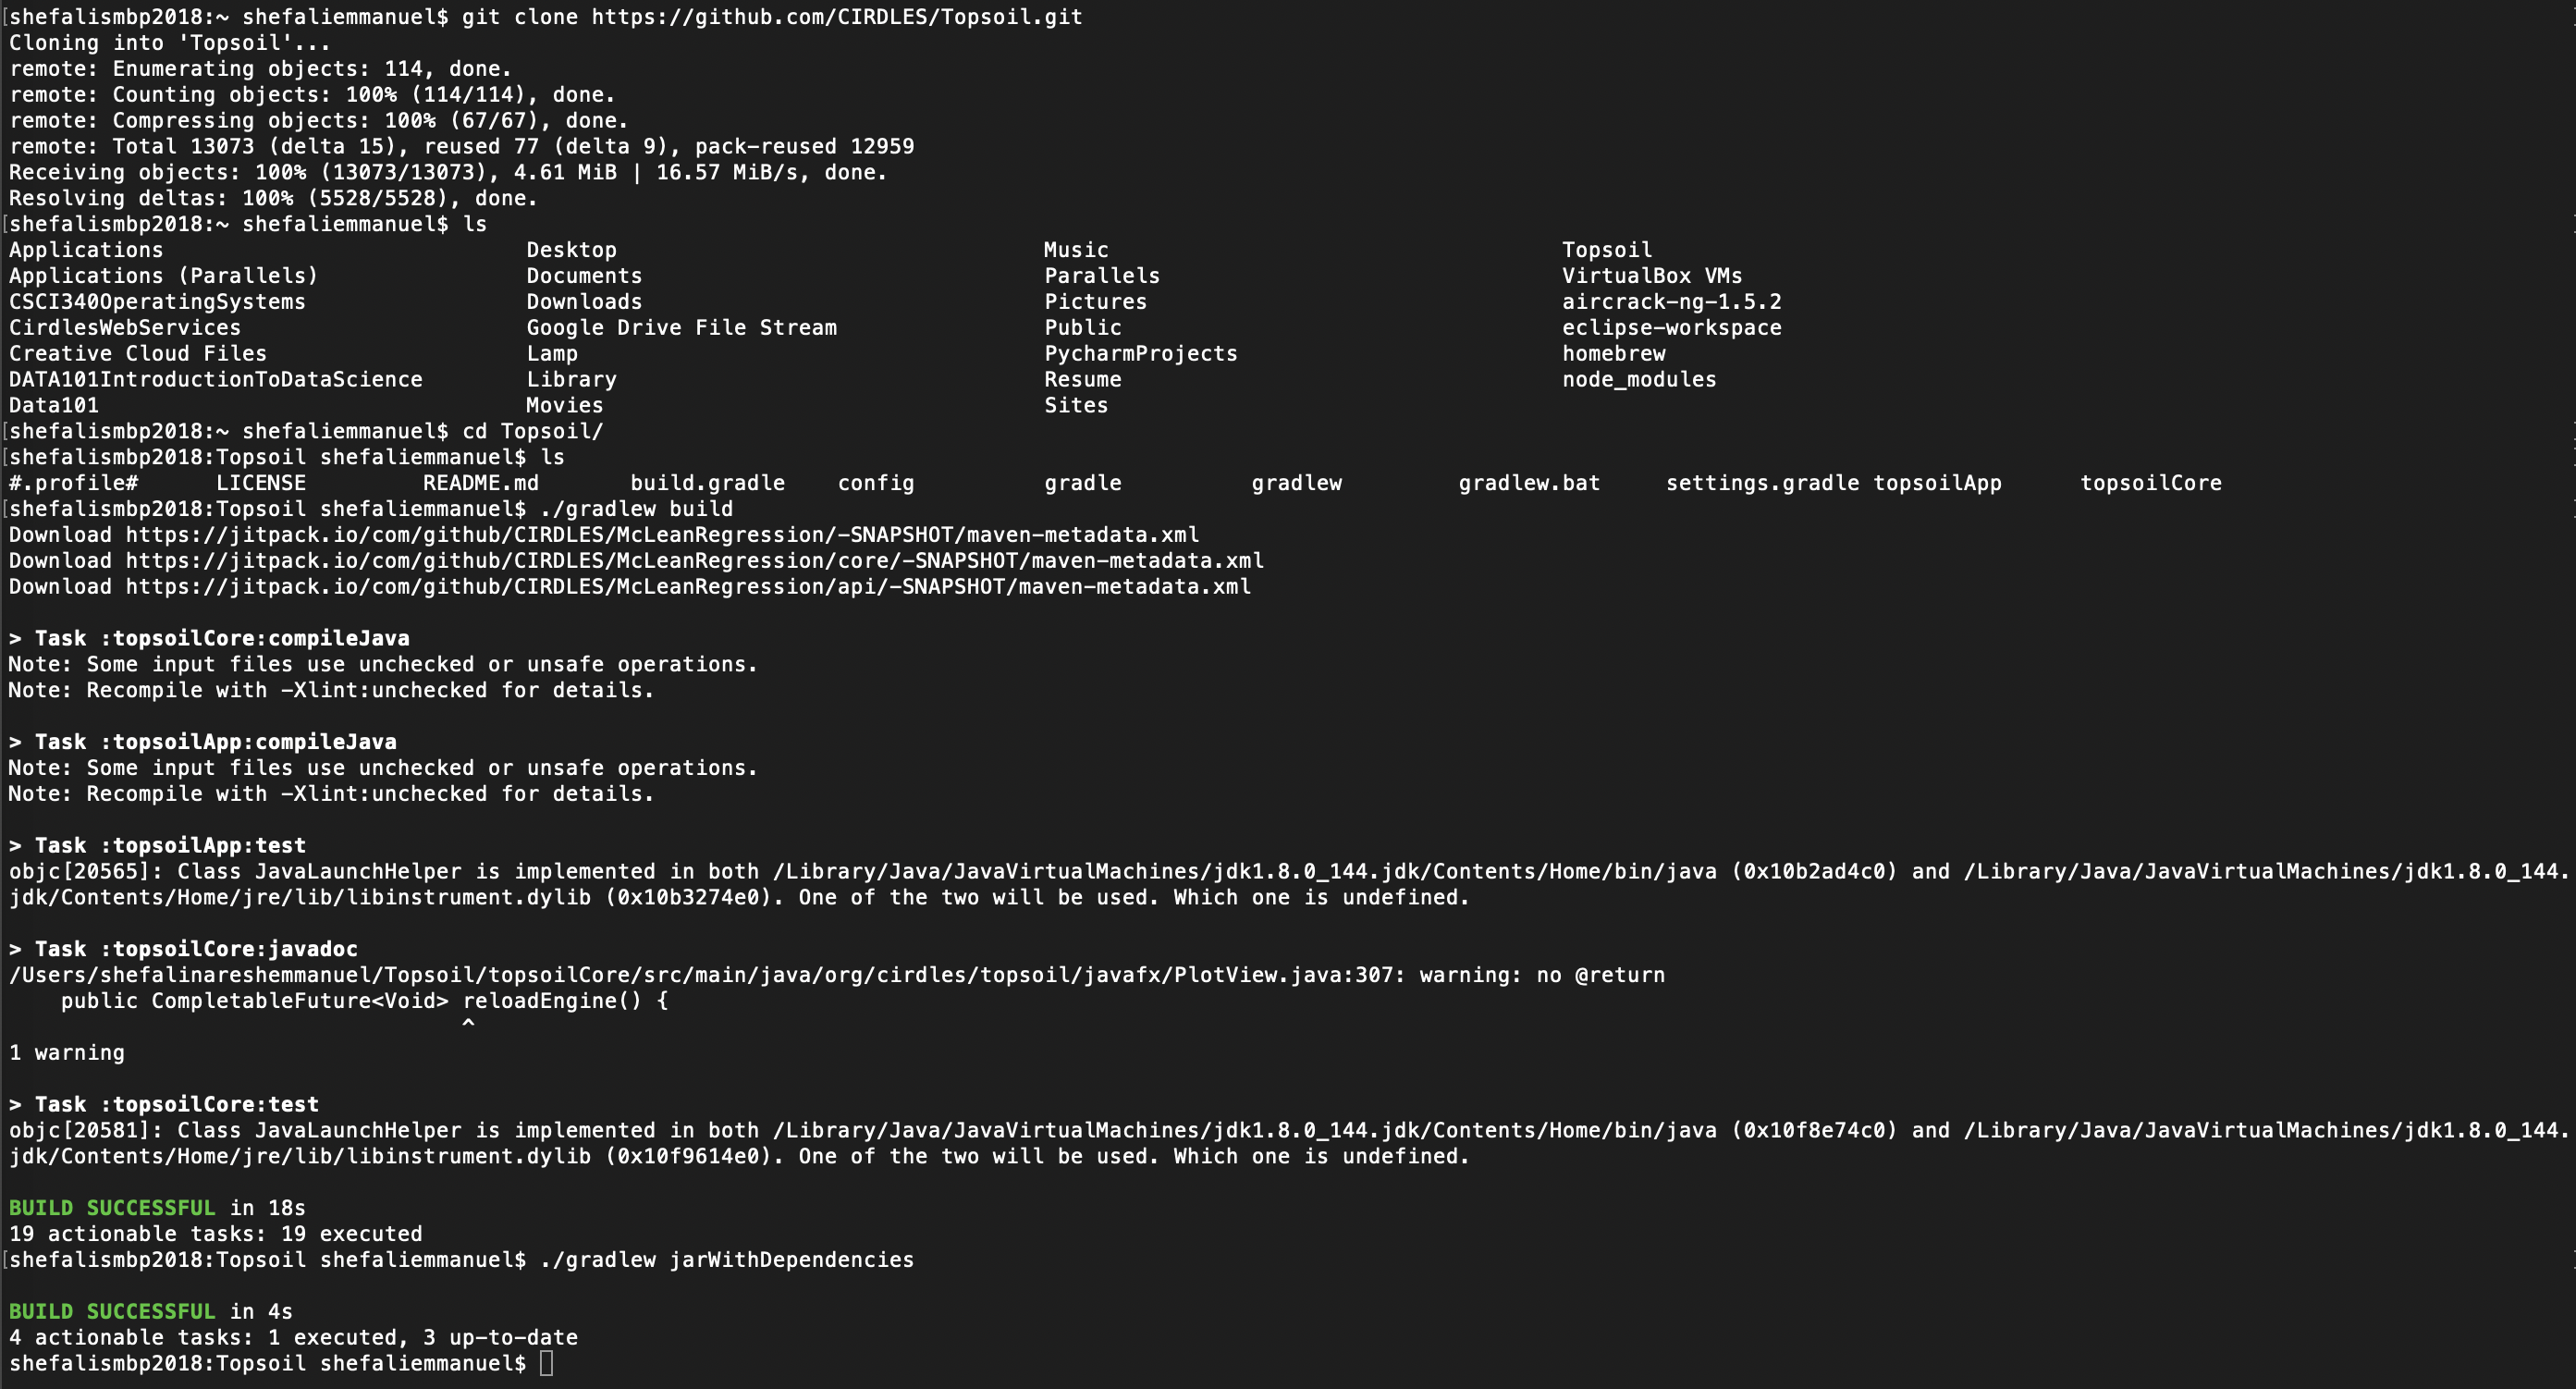
Once you have the source code, navigate to the root directory in a terminal and execute the command
./gradlew build. This will import the required resources and build Topsoil. -
After that, you can create a JAR file by running
./gradlew jarWithDependencies.Here is what my terminal looks like:
-
Download your Java JDK (this might require account creation, but it is complimentary)
-
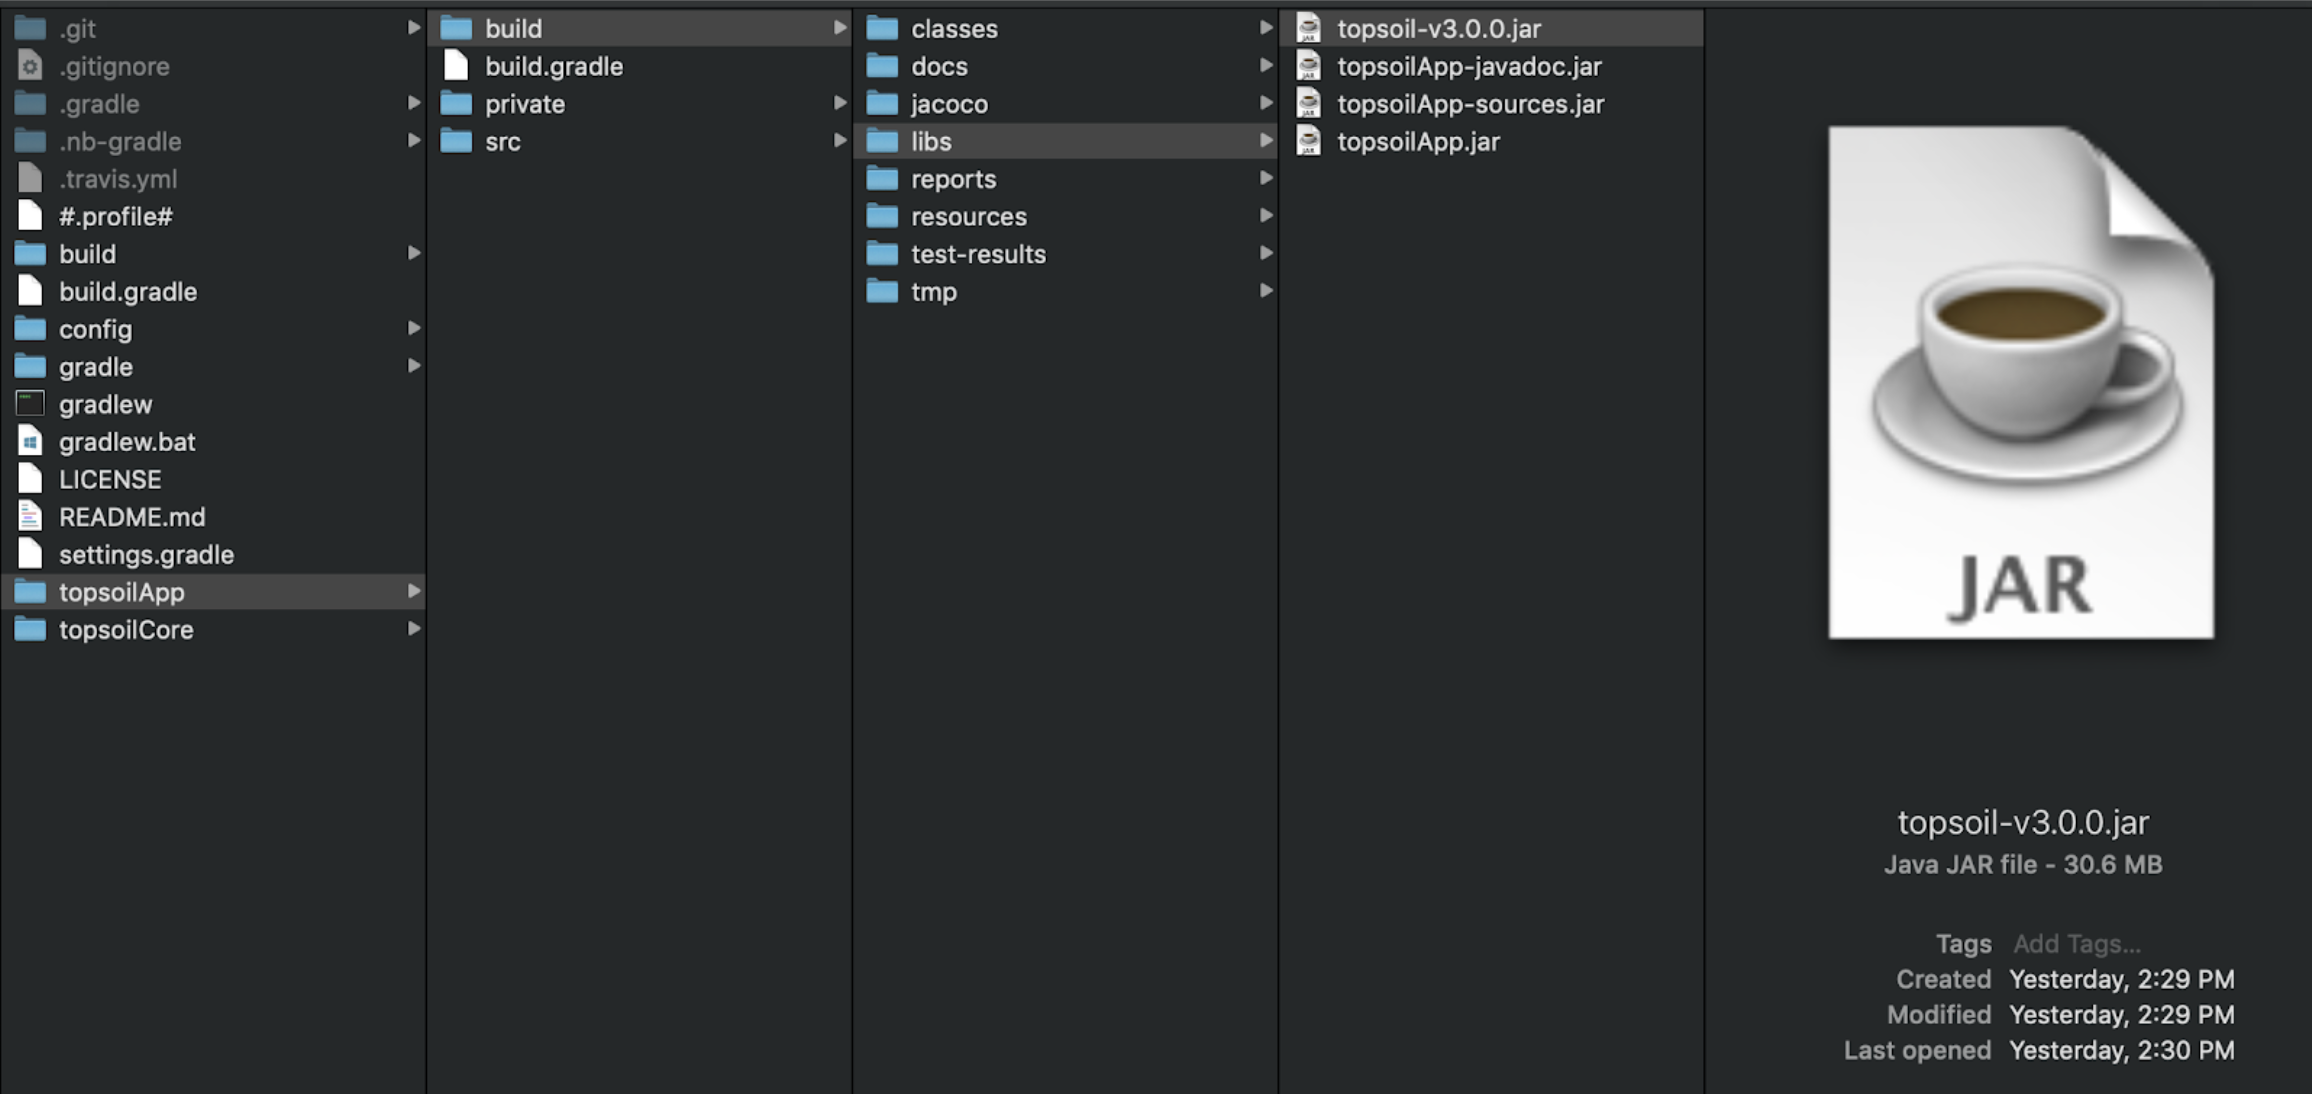
The resulting JAR file will be in Topsoil/app/build/libs with the name topsoil-[version].jar. (Typically the largest one)
-
Open jar file by double-clicking or typing “ java -jar topsoil-[version].jar” into the command line
-
-
NetBeans
-
Download Netbeans (Version 8.2)
-
What is it?
- “NetBeans IDE lets you quickly and easily develop Java desktop, mobile, and web applications, as well as HTML5 applications with HTML, JavaScript, and CSS. The IDE also provides a great set of tools for PHP and C/C++ developers. It is free and open-source and has a large community of users and developers around the world.”
-
- Download & Install Gradle Plugin (Make sure it is for Netbeans 8.2)
- What is it?
- open-source build automation tool that is designed to be flexible enough to build almost any type of software (gradle.org)
-
Why do we use it?
- Gradle models its builds as Directed Acyclic Graphs (DAGs) of tasks (units of work). What this means is that a build essentially configures a set of tasks and wires them together — based on their dependencies — to create that DAG. Once the task graph has been created, Gradle determines which tasks need to be run in which order and then proceeds to execute them. (gradle.org)
-
How to build gradle projects from terminal? (generic commands)
-
gradleTo see what version we have installed -
gradle clean buildTo build out your gradle project
-
- What is it?
-
Open the Topsoil Project
-
File > Open > Topsoil (go to the location where Topsoil is cloned on your computer
-
This is what your screen should look like
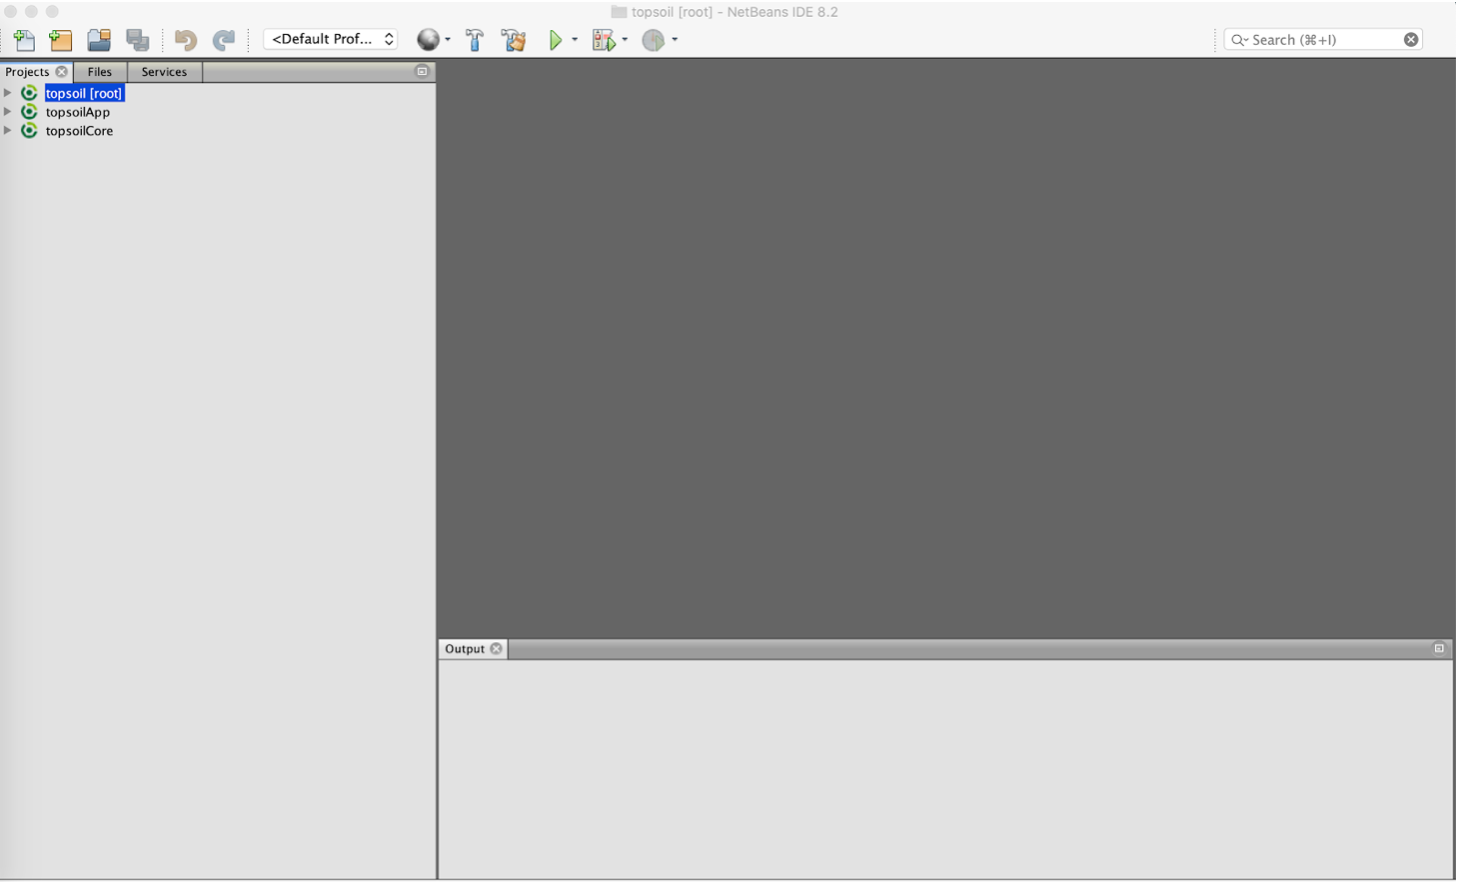
-
-
How to Import Data
When importing your data into Topsoil, you have a few options:
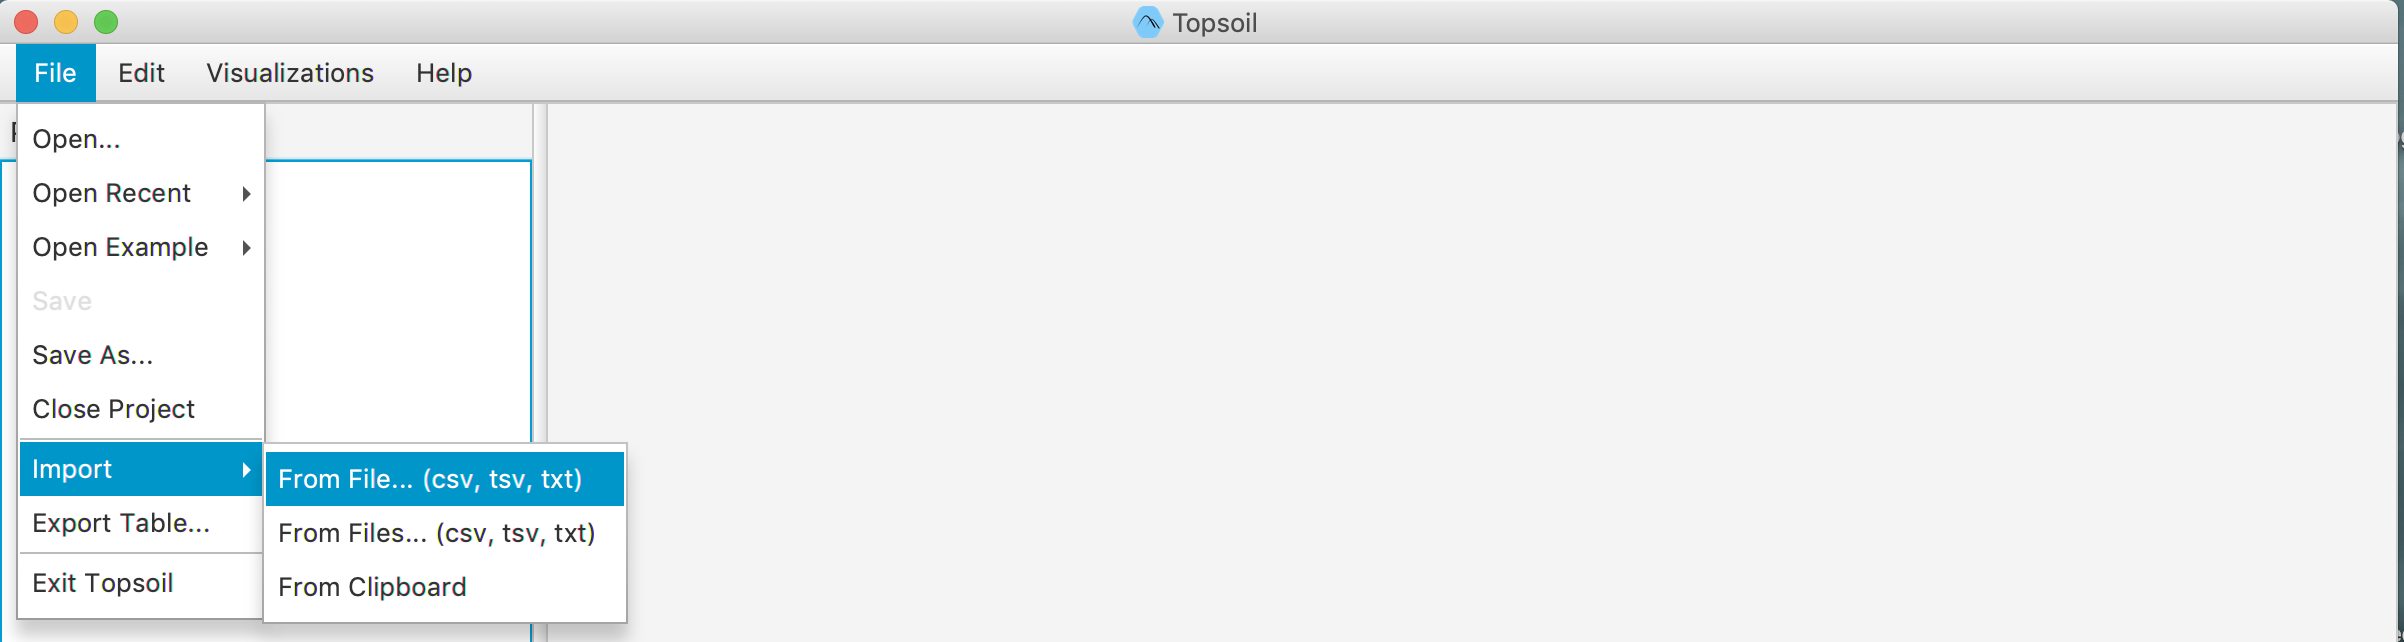
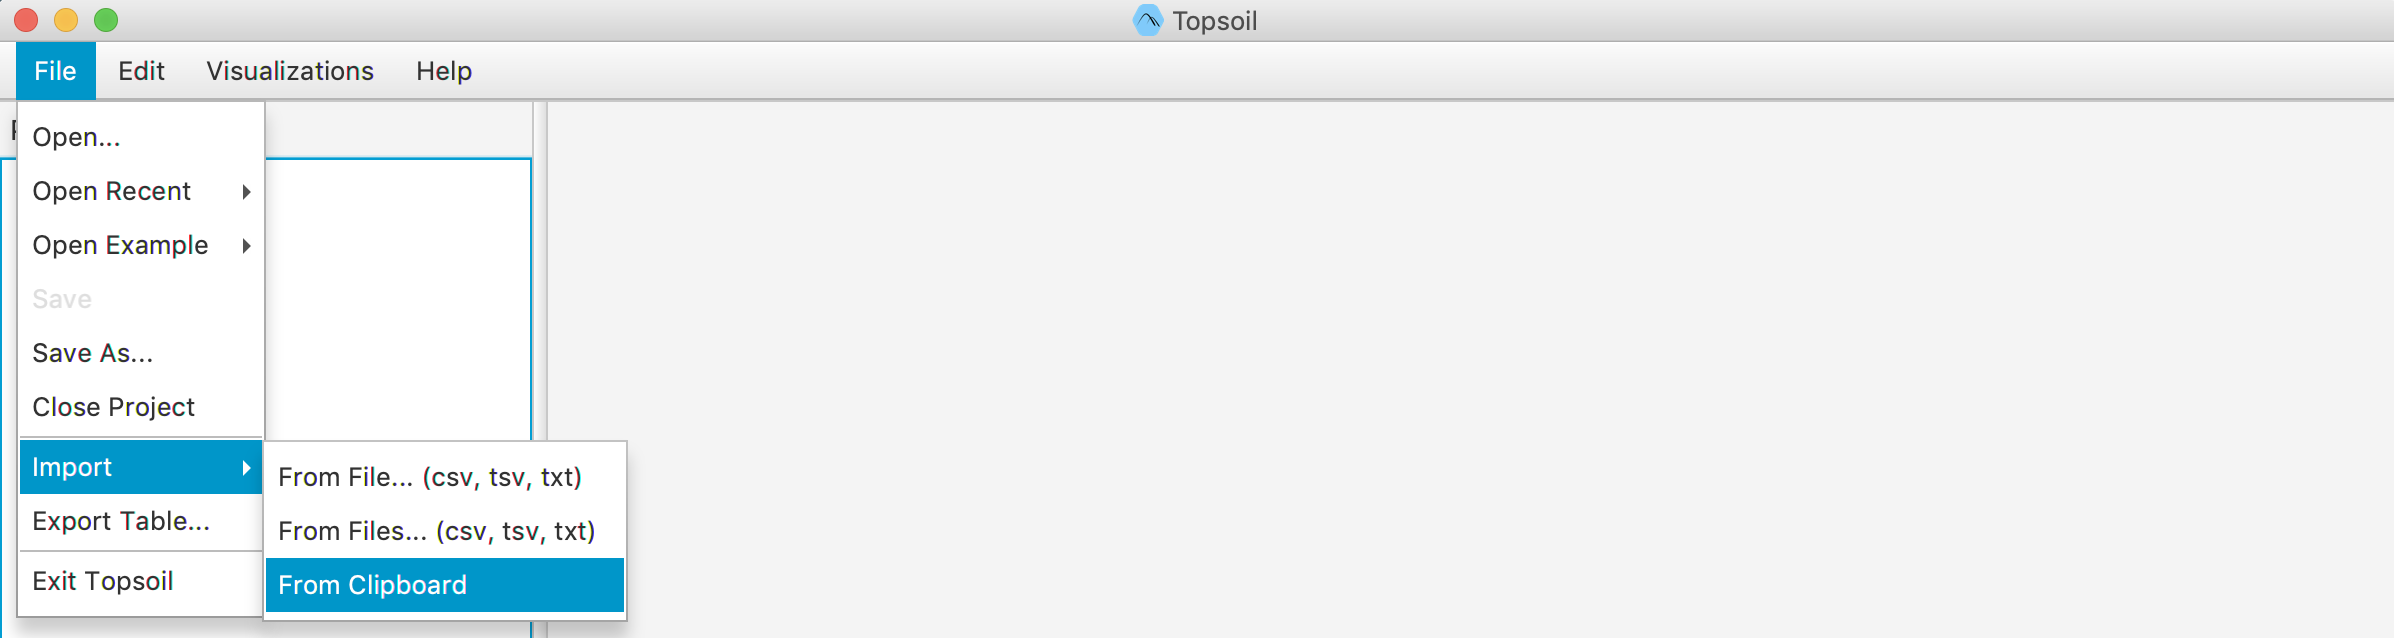
Importing from a File – (.csv, .tsv, .txt):-
Navigate to File > Import > from a File
-
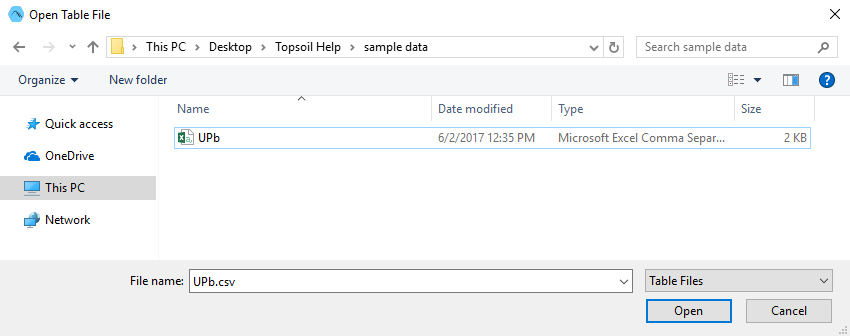
A file chooser will appear that will allow you to select the proper file from your computer.
-
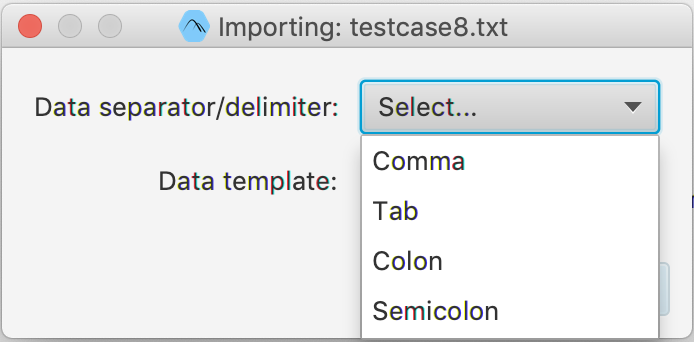
(If the delimiter request window doesn’t appear, skip to 4.) If you are importing a .txt file, and Topsoil can’t automatically determine how your data values are separated, you’ll be presented with a dialog box. You can select from common data separators from the drop-down list, or, by selecting “Other”, you can specify your own. Once you’ve specified a separator to use, click “OK”.
-
Select the Data Template
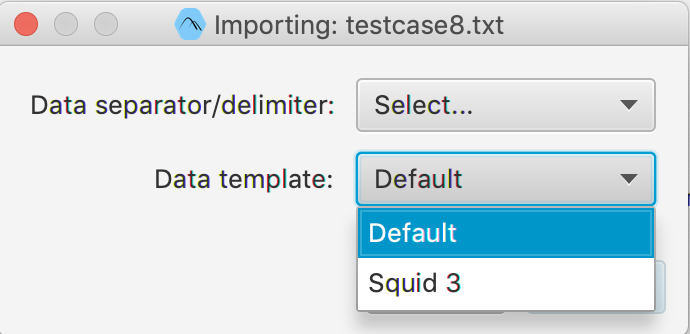
-
A helper window will appear containing a preview of your data. The column names and first five data rows are shown as they would be imported into Topsoil. Above that is a row of drop-down lists with the names of each of the five plotting variables that Topsoil uses. From this screen, you’re able to use the drop-down lists to select which of your data columns correspond to the which variables. Selecting these variables is not necessary in this step, as you will be able to change these selections later by pressing the “Assign Variables” button in Topsoil’s main window.
You’re done!
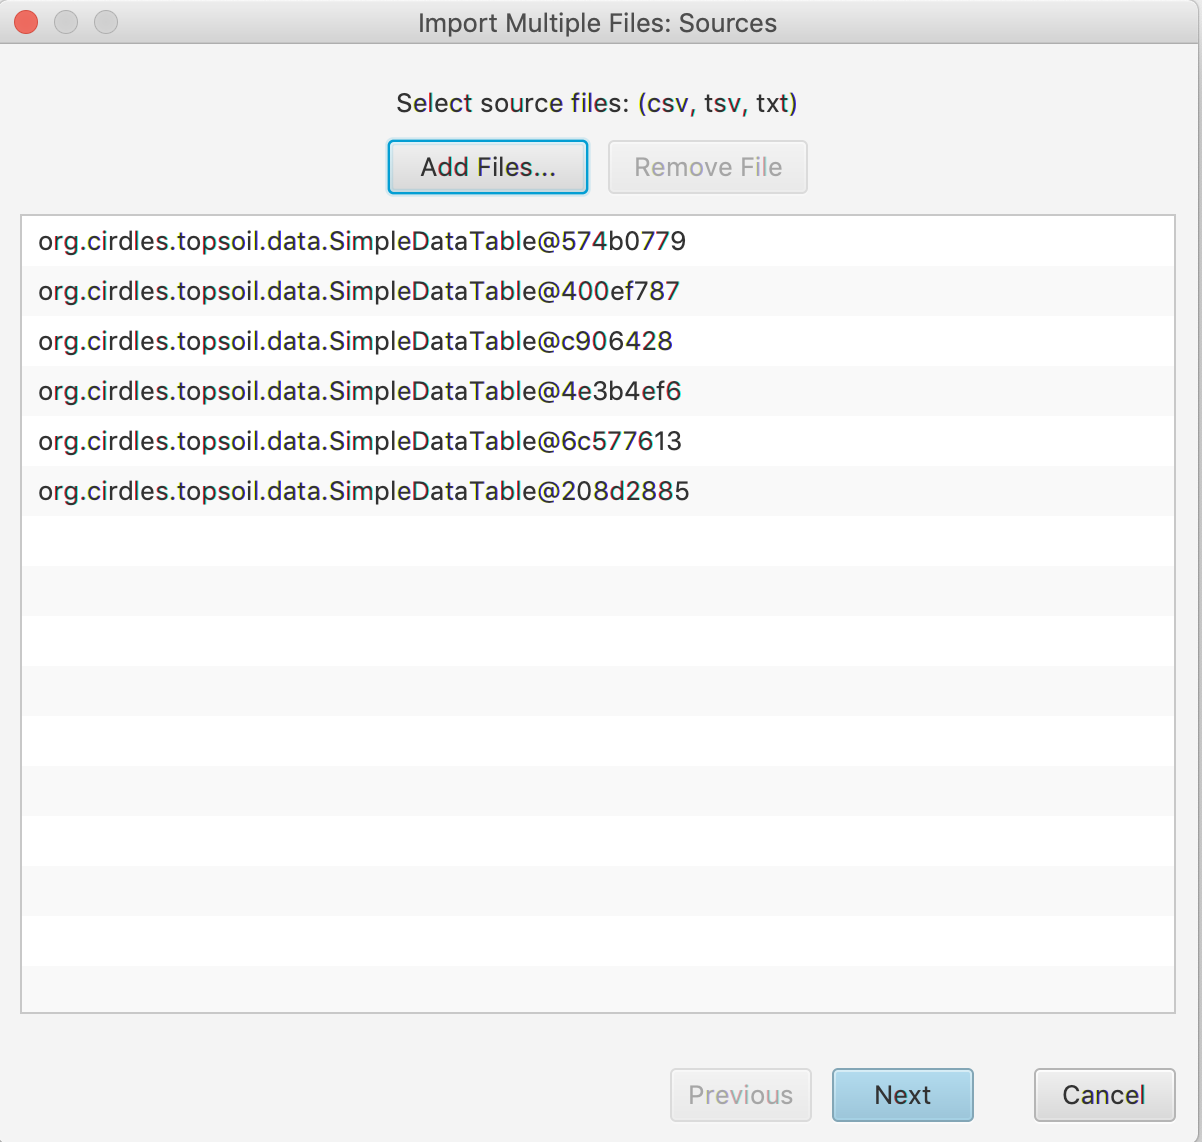
Importing from a Files – (.csv, .tsv, .txt):-
Navigate to File > Import > from a Files
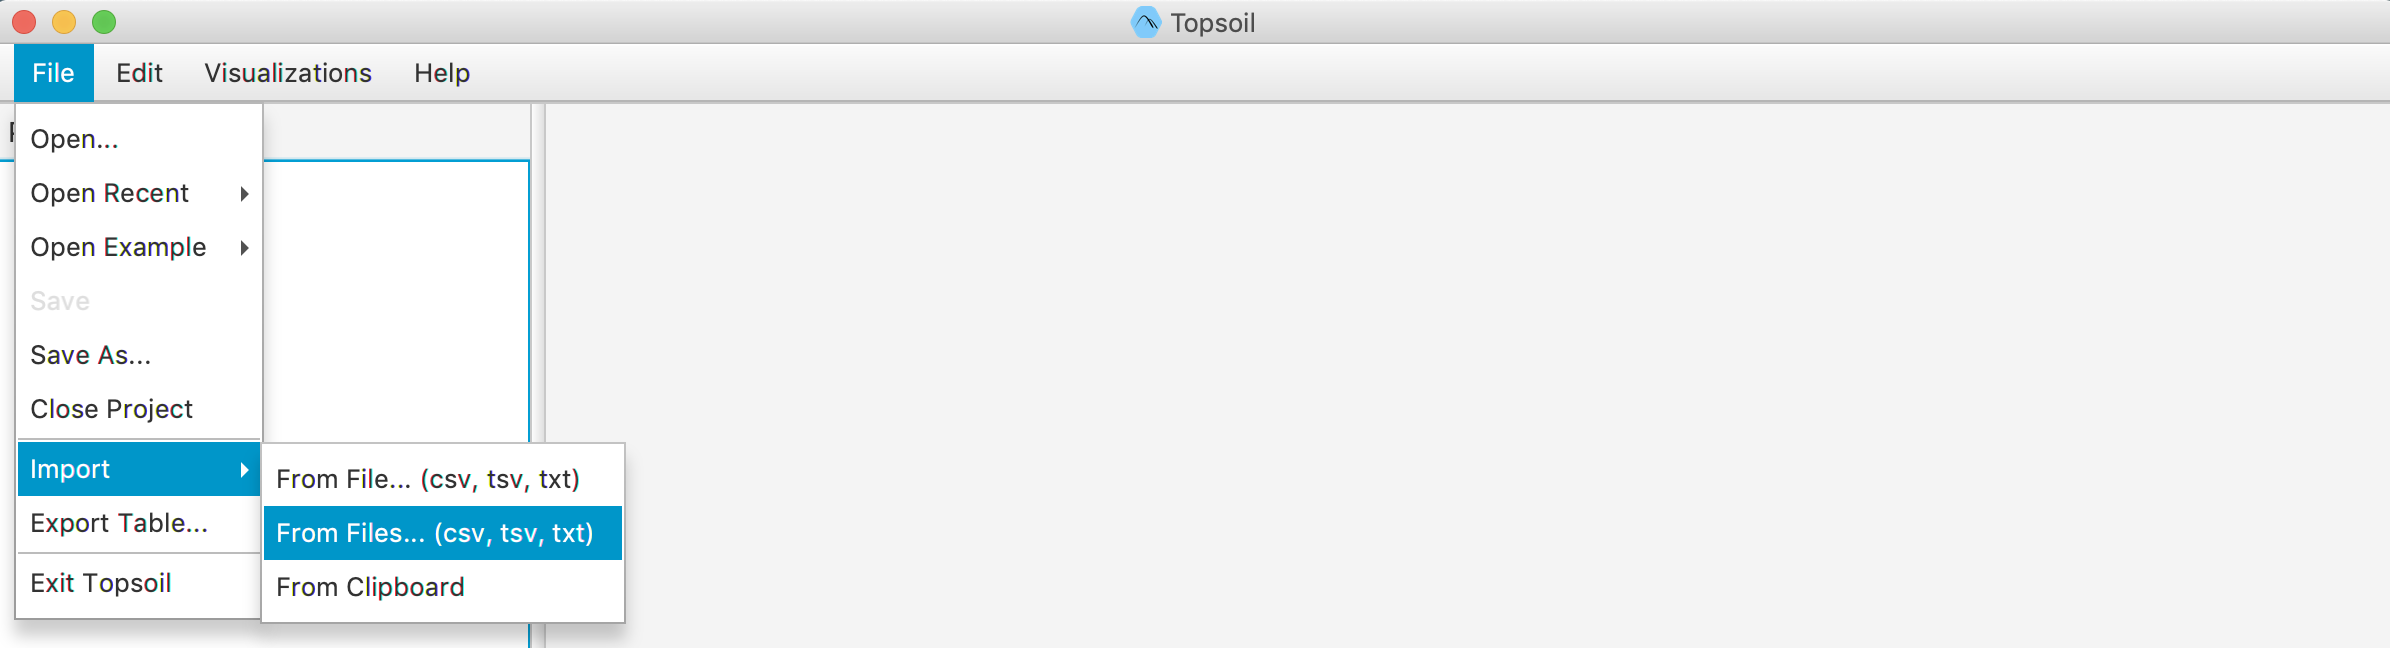
-
Click “Add Files” to browse through your computer and select the files desired
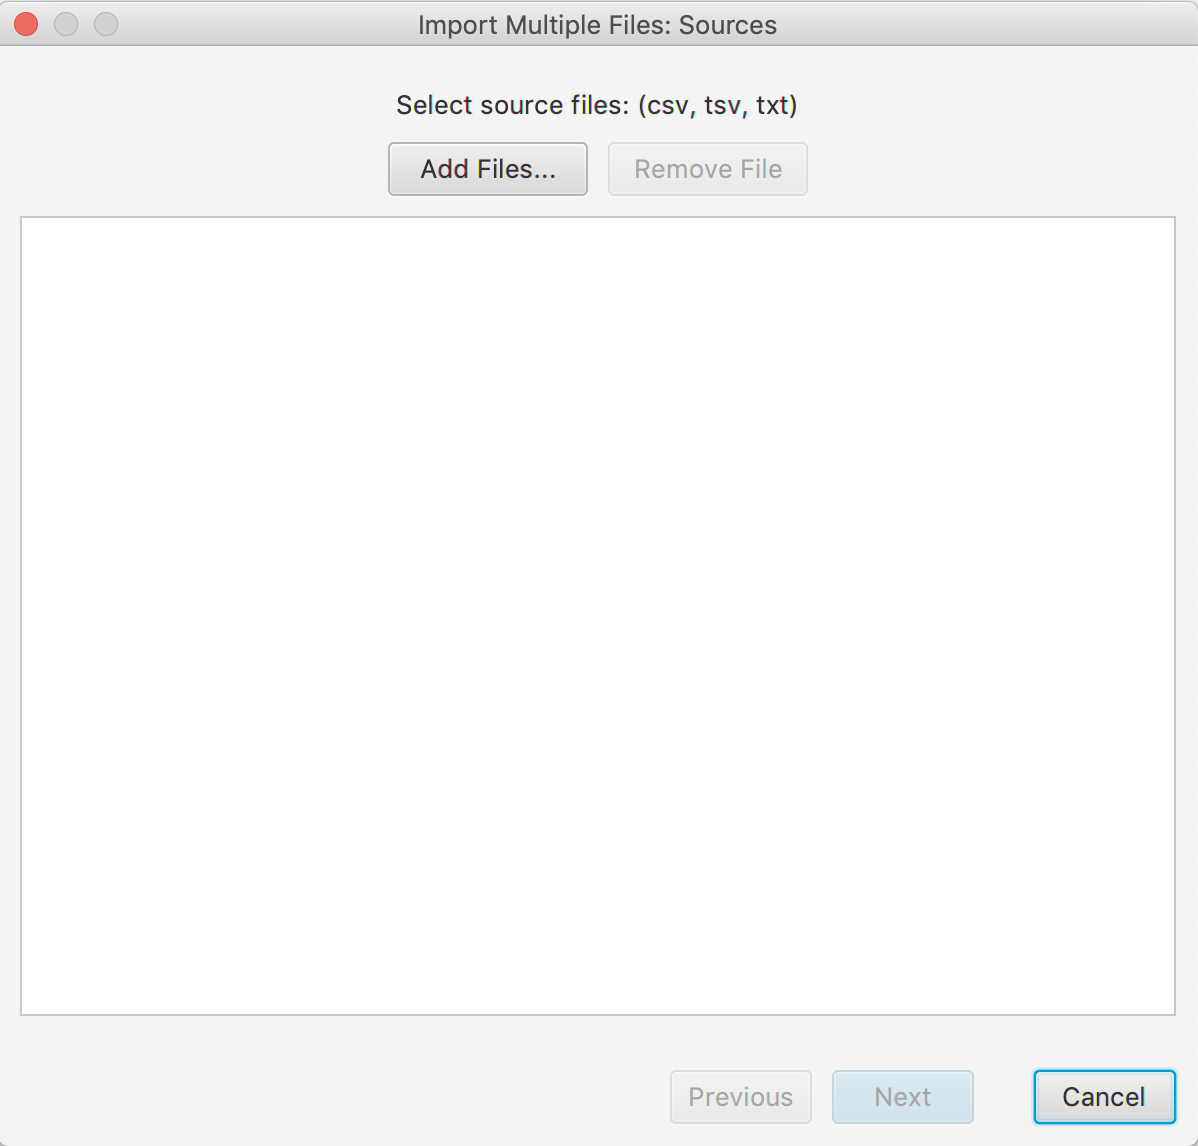
-
(If the delimiter request window doesn’t appear, skip to 4.) If you are importing a .txt file, and Topsoil can’t automatically determine how your data values are separated, you’ll be presented with a dialog box. You can select from common data separators from the drop-down list, or, by selecting “Other”, you can specify your own. Once you’ve specified a separator to use, click “OK”.
-
Select the Data Template
-
click the “Next” button upon completion
-
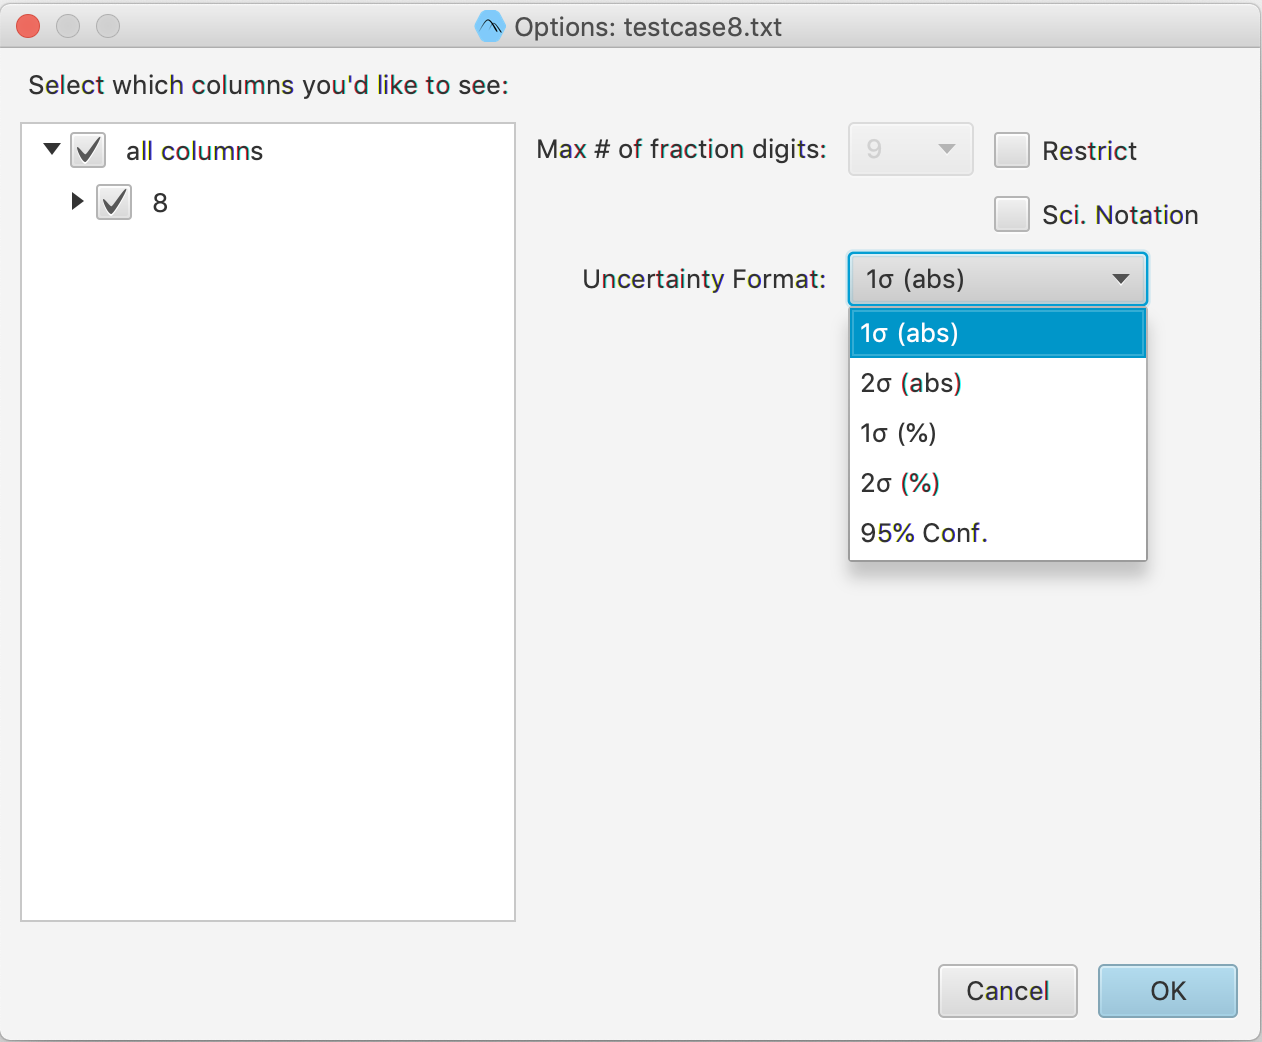
A helper window will appear containing a preview of your data. The column names and first five data rows are shown as they would be imported into Topsoil. Above that is a row of drop-down lists with the names of each of the five plotting variables that Topsoil uses. From this screen, you’re able to use the drop-down lists to select which of your data columns correspond to the which variables. Selecting these variables is not necessary in this step, as you will be able to change these selections later by pressing the “Assign Variables” button in Topsoil’s main window.
You’re done!
Importing from the Clipboard:-
Navigate to Table » Import Data Table. Select “From Clipboard”.
-
(If the delimiter request window doesn’t appear, skip to 4.) If you are importing a .txt file, and Topsoil can’t automatically determine how your data values are separated, you’ll be presented with a dialog box. You can select from common data separators from the drop-down list, or, by selecting “Other”, you can specify your own. Once you’ve specified a separator to use, click “OK”.
-
Select the Data Template
-
A helper window will appear containing a preview of your data. The column names and first five data rows are shown as they would be imported into Topsoil. Above that is a row of drop-down lists with the names of each of the five plotting variables that Topsoil uses. From this screen, you’re able to use the drop-down lists to select which of your data columns correspond to the which variables. Selecting these variables is not necessary in this step, as you will be able to change these selections later by pressing the “Assign Variables” button in Topsoil’s main window.
You’re done!
Features
The following is a very basic walkthrough of some of Topsoil’s features.
-
Open Topsoil. An about page will pop up, simply click anywhere off of the page to dismiss it.
-
From the menu bar, select Data Table > Open Example Data Table > Uranium-Lead. This will populate Topsoil with some sample data from a Uranium-Lead analysis.
-
Underneath the table is a section labeled “Plot Manager”, containing several options for manipulating a plot, which we have yet to generate! Click the button “Generate Plot”.
-
A separate window should have appeared, with the plot inside of it. From “Plot Manager”, click the check box “Unct. Ellipses”. There should now be uncertainty ellipses surrounding the data points on the plot. You can change the color of these ellipses at any time using the color picker next to the check box.
-
Now turn on the check box that reads “Wetherill Concordia Line”.
-
Click-and-drag and zoom inside of the plot until you get to a position you like. If you get too far away from the original view, click the “Re-center” button above the plot to re-center the view to the data.
-
Click the button “Save as SVG”, and save the file as something like “testPlot.svg”.
-
Back in the main window, from the menu bar, select Project > Save Project As. This option lets you save your current working state as a .topsoil file, so when you open this file again, your tables and plots will be automatically loaded.
-
Save the project as something like “test.topsoil”.
VisualNavigationGuide
Topsoil

TopsoilApp (Where you run Topsoil)

TopsoilCore

Information
Citation
To cite Topsoil, please provide a footnote or acknowledgement as follows:
J.F. Bowring, PI CIRDLES.org Open Source Development Team. Topsoil - A community driven replacement for ISOPLOT. Apache License, Version 2.0. https://github.com/CIRDLES/topsoil.
License
Acknowledgements
The Topsoil project receives funding from NSF grants #1443037 and #1440351, as well as from Geoscience Australia. Special thanks to Dr. Kenneth Ludwig, author of the Isoplot plug-in, and to the Department of Computer Science at the College of Charleston.
Future Goals
- Allow import of larger Squid data files
- Support for multiple plot generation at any given time
- Support for viewing multiple datasets on a single plot
- Ability to toggle certain data values within a plot
- Interaction with data points of a plot
- Weighted mean visualizations
- Perform analysis-level calculations
- Support for a step-by-step guidance through calculations
- Introduction of other Isotope systems for plotting
- Support to save and recall customizations
- Robust table system to allow better interaction with data
Interested in Contributing
Topsoil uses GitHub to host its code and for version control, and it uses GitHub “Issues” to track bugs, suggestions, or requests reported by users. In order to create an Issue on GitHub, simply go to Topsoil’s repository and click the “Issues” tab, then click “New Issue.” Alternatively, the Help menu within Topsoil contains a “Report Issue” button, that will open the new issue form in a browser window.
In addition to taking cues from its community, Topsoil accepts code contributions from its community. Issues that are introductory-level or simple for someone who isn’t familiar with the code are marked as such. Any user who wants to take on one of these issues, create a custom data template, or make other changes is free and able to do so.